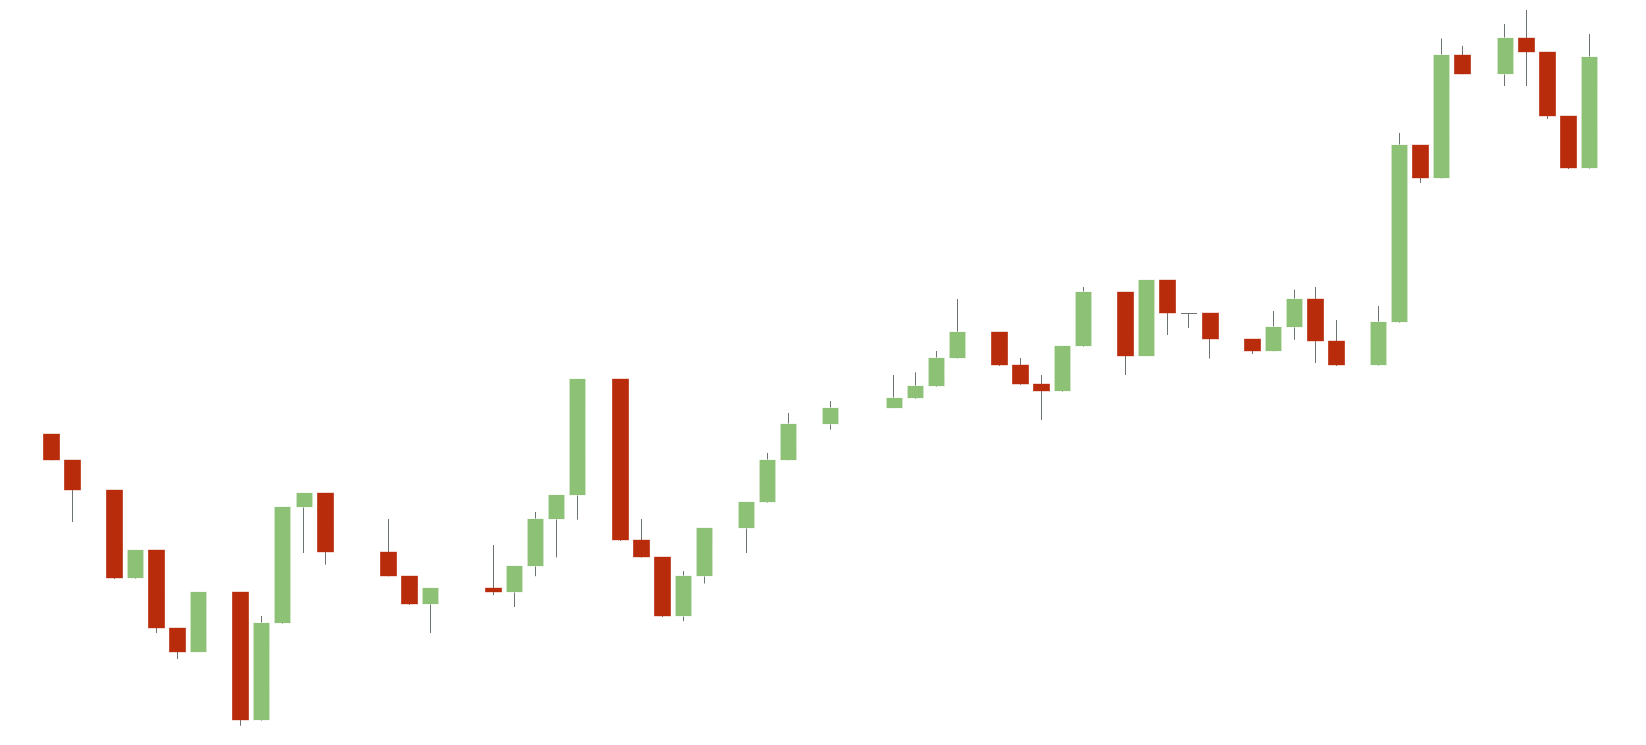
Most traders rely on the daily moving average (DMA) of the stocks. The moving average is a line on the charts that show the behavior of a stock over a period of time. These charts show the opening and closing rates of the stock. The minimum average line shows the average closing rates of that particular stock in the given interval and helps you comprehend the ups and downs in the price and determine the flow of the stock.
These are bands that show the standard deviation of the stock. It consists of three lines - the moving average, the upper limit and the lower limit. If you seek the trading ranger of a particular stock, these help you locate the price variation of the stock over a period of time, hence, you can put your money around the observations.
The stock prices are highly volatile. Such variations largely depend on market situations. If a trader wants to know whether a stock would rise or fall, this is where the momentum oscillator is beneficial. It is depicted in a range of 1 to 100 and shows whether a stock would further rise or fall, helping you in determining when to buy a particular stock. It shows the right time to trade, not making you lose your chances.